

How to predict customer churn using machine learning, data science and survival analysis


Customer churn and data science
Customer churn is a major concern for any business. It is the process of customers leaving their service provider for a competitor’s service. This can be due to many different reasons, including financial constraints, poor customer experience, or just general dissatisfaction with the company. Predicting customer churn is an important part of running any business because it will allow you to plan ahead and mitigate the effects of this happening in your company.
The importance of predicting customer churn comes from the fact that businesses have limited resources and cannot afford to lose customers if they want to stay profitable. If a company has too many customers leave, it will not be able to produce enough revenue and will eventually go bankrupt. However, predicting customer churn allows companies to avoid this by better understanding why customers are leaving and what they can do about it.
The Tesseract Academy recently worked on a very interesting customer churn prediction problem with a large insurance company based in London and San Fransisco. In this
In this article we will dive into the nuts and bolts of how the Tesseract Academy managed to successfully predict churn and increase the client’s bottom line.
Using machine learning for churn
The full article and case study can be found here: Tesseract Report: Customer churn prediction through data science and AI The Tesseract’s Academy content is targeted towards decision makers, so the case study speaks in a high level language. In this article we will examine some of the methods that we used in order to make the project successful. More specifically, we will delve into some of the survival modelling techniques we used in order to predict which customers will churn and better understand the factors that influence them.
Survival analysis in data science
Survival modelling is a sub-branch of data science that deals with the question of how long something can survive. It’s originally called survival modelling, because the questions that it was trying to answer were around survival of patients in the medical domain. However, the same principles can be applied in many different settings, from survival of companies, to survival of customers. In this case, a customer is considered to have not survived, if they leave the company.

Survival analysis combines classification and regression. It tries to answer two questions simultaneously:
Will someone survive? Yes or no?
If he does not survive, what is the probability of surviving up to a certain point?
Survival modelling allows the inclusion of “censored data”. Censoring takes place when we are following an entity (a customer in this particular churn case study), but we do not have data before or after the period of interest.

censoring survival analysis
For example, let’s say that we have a dataset of 100 customers. We know that 30 of them churned, and 70 have not. We know that some of these 70 customers will eventually churn. Maybe they will churn next day, or maybe in 5 years. We don’t really know. But what we do know is that they have survived up to this point.
Traditional classification and regression methods from supervised learning do not allow us to use this information. But survival modelling does.
Here are some of the most common survival analysis algorithms
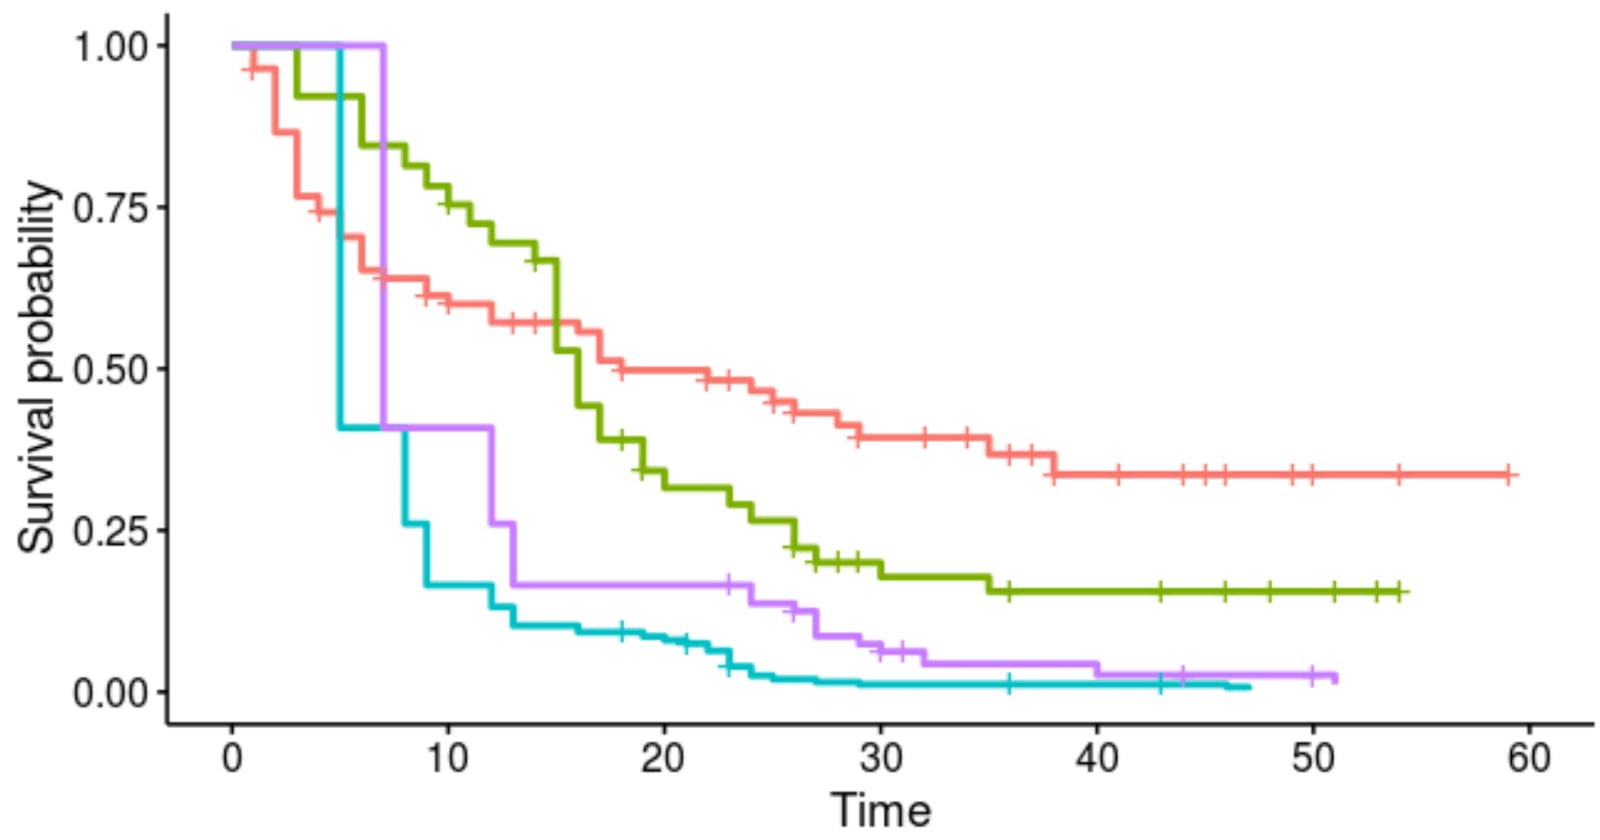
Kaplan-Meier curve: The Kaplan-Meier curve is a non-parametric tool that allows one to visualise the impact that different categories can have on survival. This was one of the first tools that we used. This method cannot be used for predictive purposes, but it is a great tool to use when communicating to the stakeholders, as it is easy to understand.

The Kaplan-Meier curve is a common tool user for survival analysis
Cox proportional hazards model: This is a very famous semi-parametric model created by the late and legendary statistician David Cox. The Cox proportional hazards model allows the estimation of risk, without needing the specification of a distribution. In this particular project, we used Cox proportional hazards as a first method, in order to understand how different characteristics influenced the baseline hazard. While it’s not the best model for prediction, it is very useful when you want to understand the impact that one variable can have on survival.

Sir David Cox, one of the greatest statisticians of all time
Weibull regression: This is a parametric model for survival analysis. It is based upon the Weibull distribution (As the name implies). An interesting property of Weibull regression is that it can accommodate many different types of survival. It can be used to model the survival of biological organisms (that eventually die), or even the survival of cultural artefacts, whose probability of survival increases the longer they’ve been around for.
Survival support vector machines: This is an extension of the classic support vector machine algorithm into a survival setting. While we used this method, we found it to be very slow, which is a common issue with many kernel methods. However, it might be useful for smaller datasets.
Survival forests and gradient boosted survival analysis: In the last few years there have been some adaptations of classic machine learning algorithms into the survival analysis frameworks. Survival forests is the most famous one. There is also an extension of gradient boosted trees into survival analysis. We found both of these methods to be quite fast and produce very good results for our problem.
Evaluating survival models
When evaluating any machine learning model, the metrics are one of the most important things to consider. Because survival analysis combines classification and regression, traditional classification metrics might not work as well. Therefore, we have to resort to other means.
One of the most common means of evaluating survival is the censored concordance index, or c-index for abbreviation. We have met the concept of concordance in another post, where we had talked about the merits of using the concordance correlation coefficient as a metric to assess the performance of regression algorithms.
This metric is also called Harrell’s c-index and is calculated as shown in the formula below:

A concordant pair is a pair (of two clients in our case), where the model predicted that one customer would churn before another, and the prediction was correct. A discordant pair is a pair of two customers, where the model’s prediction was off. This means that the model predicted that a customer would stay for longer with a company, but they didn’t.
You see that because we are evaluating survival, the actual prediction is different to what it would be than if we were evaluating a classification or regression model.
How to run survival analysis
One of the best packages for survival analysis in Python is scikit-survival. This is an amazing package that is using a scikit-learn type of interface in order to provide access to all of the mainstream survival analysis algorithms found in the machine learning community.
For the more statistically oriented, R is a better option. There is a survival package in R, which can do pretty much everything: from Cox regression, to Kaplan-Meier curves and Weibull regression.
The difference between them is that the R package is primarily focused on statistical methods, whereas scikit-survival is focused on machine learning ones.
Data science, AI and machine learning
So, I hope you found this informative! If you are interested to know more about topics like data science, AI and machine learning, make sure to get in touch. I am always open to mentor new students, and I am also organising my own data science and machine learning training bootcamp. Also, make sure to check out the page of the Tesseract Academy if you are a CEO or an entrepreneur who wants to use AI and data science.